Your campus already knows which students are drifting: a quiet LMS, a missed first assignment, a hold no one saw. Learn which signals to watch, how to turn them into help from a real person, and how to keep student trust at every single step.
Learning analytics in higher education means using the data your systems already collect, in the learning management system (LMS), the student information system (SIS) and the CRM, to spot students who need help early and act on it. The value is not in more dashboards. It comes from a few well-chosen signals, one clear question and an advisor who knows what to do next.
Every login, click and submission leaves a trace. Together, these traces are campus telemetry: automatic records of what happens across your systems. The 2026 EDUCAUSE Top 10 describes the problem plainly: institutional data are “siloed and scattered across systems.” This guide shows how to turn that data into decisions students can feel.
What campus telemetry is, and why most of it goes unused
Higher education telemetry is the stream of events your systems record on their own. Common examples:
- LMS: logins, page views, assignment submissions, quiz attempts and discussion posts.
- SIS: registration, adds and drops, grades and holds.
- CRM: emails opened, appointments booked and advising notes.
- Campus services: Wi-Fi connections and ID card swipes at the library or dining hall.
Most of it goes unused for three reasons. It sits in separate systems that do not talk to each other. Nobody has decided which questions it should answer. And staff are unsure what they are allowed to do with it. EDUCAUSE lists both “Building a Data-Centric Culture Across the Institution” and “Decision-Maker Data Skills and Literacy” among its top issues for 2026. The gap is about people and habits as much as tools.
From reports to predictions to action: the analytics maturity ladder
EdTech analytics usually grows in four steps. Each one builds on the one before.
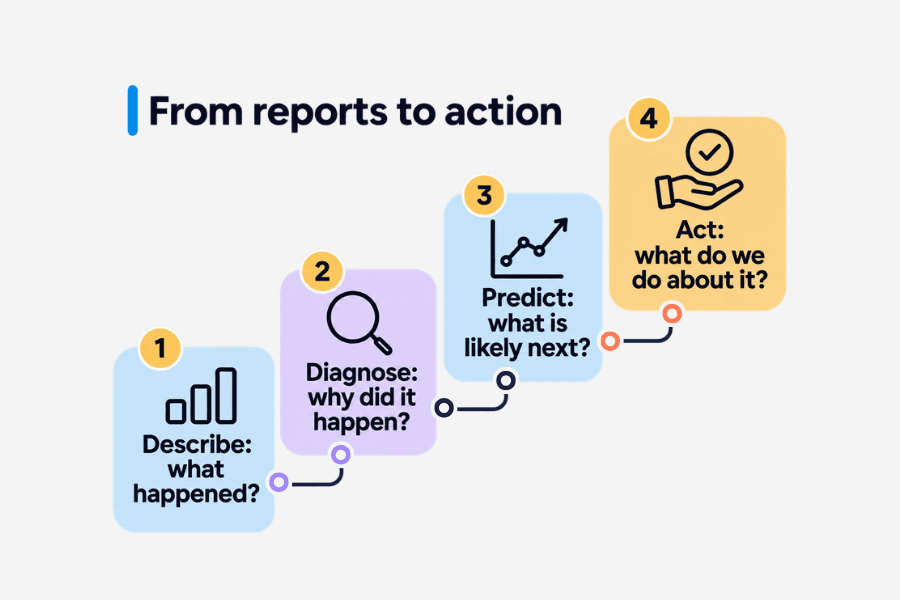
- Describe: what happened? Reports on enrollment, grades and course completion.
- Diagnose: why did it happen? Comparing groups, courses or terms to find patterns.
- Predict: what is likely to happen? Models that flag students at risk of failing a course or not returning.
- Act: what do we do about it? Alerts that reach an advisor or instructor with a clear next step, and tracking whether it helped.
Many campuses stop at the third step. A risk score that nobody acts on changes nothing. The last step is where student success analytics earns its budget: a named person, a simple action and a way to measure the result.
The signals that matter for student success
You do not need every data point. A short list of early signals is easier to explain, easier to act on and usually enough to start:
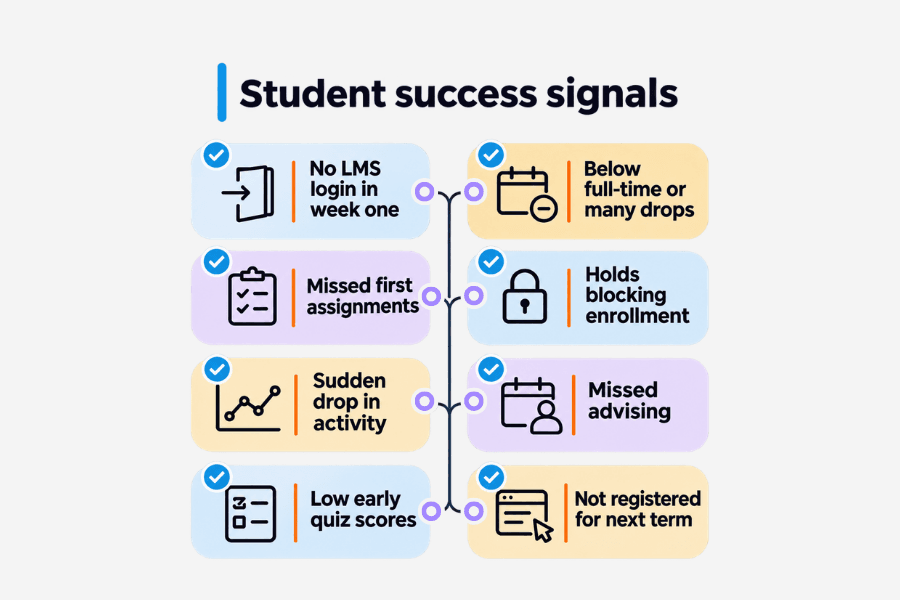
- No LMS login in the first week of the term
- Missed or late first assignments
- A sudden drop in LMS activity after steady use
- Low scores on early quizzes in gateway courses, the large introductory courses many students must pass
- Dropping below full-time, or several course drops in one term
- Registration or financial holds that block next-term enrollment
- Missed advising appointments or unanswered outreach
- Not yet registered for next term once registration opens
Each signal needs an owner and an action. A first-week no-login might prompt a friendly check-in from the instructor. A hold might prompt a call from financial aid. Then watch the outcome that matters most: whether students come back. According to the National Student Clearinghouse Research Center, 69.1% of students who started college in fall 2024 returned to the same institution the next fall. Every point of improvement there means real students who stayed.
Connecting LMS, SIS and CRM data
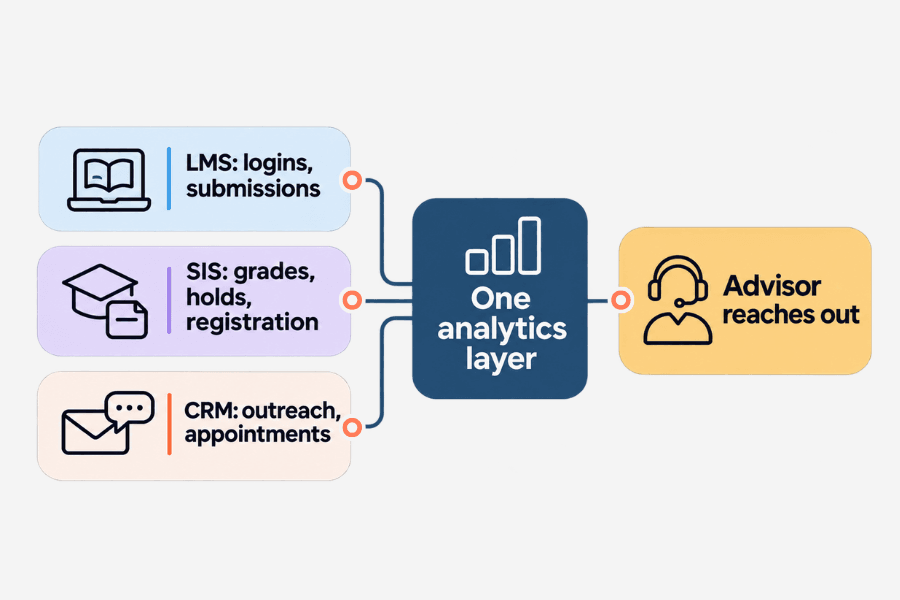
LMS data analytics shows how a student is engaging in a course. The SIS shows where they stand academically. The CRM shows who has reached out to them and how. On its own, each gives a partial picture. Together, they show the whole student.
Three practical steps help:
- Agree on one student ID that links records across systems.
- Decide which data moves, how often, and who owns each field.
- Use open standards where possible. 1EdTech’s Caliper Analytics standard, for example, describes learning activity data in a common format so different tools can share it.
Talentus Global’s SIS, LMS and CRM connectors link student information systems with LMS tools such as Canvas, D2L, Moodle, Blackboard and Open LMS, and with CRM platforms, so data moves without manual exports. The same connected data supports the whole student journey, from AI in student recruitment to advising and graduation.
Privacy and trust: what students should know
Analytics only works if students and faculty trust it. A few guardrails help:
- Follow FERPA, the US student privacy law. The Department of Education’s Student Privacy Policy Office explains what institutions may share and with whom.
- Collect only what you need for a stated purpose, and delete what you no longer use.
- Tell students, in plain words, what you track, why, and how it helps them.
- Use analytics to offer help, never to punish. A risk flag should open a conversation, not a file.
- Check models for bias. If a prediction flags one group far more than others, find out why before acting on it.
- Limit access to the staff who need it for their role.
Location-style data, such as Wi-Fi connections and card swipes, deserves extra care. Many institutions leave it out unless there is a clear benefit to students and they know about it.
How to start with learning analytics in higher education: one question, not one dashboard
The fastest way to waste an analytics budget is to build a dashboard and hope someone uses it. Start with one question instead, such as: “Which first-year students are unlikely to register for spring, and who will contact them?”
- Pick one question tied to a goal leaders already care about.
- Check whether the data exists and is good enough.
- Run a small pilot with one group of advisors or one set of courses.
- Measure the result against a comparison group.
- Scale only what works.
This is how Talentus Global approaches AI analytics for higher education: a Feasibility Analysis that ends with a clear go or no-go recommendation, an MVP on one use case, then Scale to Production. Its Enrollment, Retention, Learning and Employability Vistas each start from a specific question, not a generic report.
FAQ
What is learning analytics in higher education?
It is the use of data from campus systems, such as the LMS, SIS and CRM, to understand how students are doing and to help them in time. Good programs focus on a few clear signals, connect them to a person who can act, and measure whether that action improved outcomes like retention.
What data do colleges use for student success analytics?
Most start with LMS activity, such as logins and assignment submissions, plus SIS data like grades, course drops, holds and registration status. CRM records of outreach and advising add context. Some institutions also use campus services data, but location-style data needs extra care, a clear purpose and transparency with students.
Is learning analytics allowed under FERPA?
Yes, when it is done for legitimate educational purposes by staff who have a real need to know. Institutions should limit access, document how data is used, and be transparent with students. The US Department of Education’s Student Privacy Policy Office publishes guidance; check your own policies with your privacy or legal team.
How long does it take to see results?
A focused pilot on one question can show early results within a single term, for example whether students contacted after a missed first assignment completed the course more often. Building a full program across systems takes longer, so start small, measure honestly and expand what proves its value.
Next step
You do not need a new data warehouse to begin. You need one good question and the right signals behind it. Talk to an EdTech specialist about one analytics question for your campus.