In the high-stakes financial landscape of 2026, tech investment is no longer just about line items; it’s about Capital Efficiency. For the modern CFO, the traditional trade-off between "Cheap Offshore" (which incurs a high "Latency Tax") and "Expensive Domestic" (which drains the innovation runway) is a binary choice that no longer works.
At Talentus Global, we’ve moved beyond the pitch deck to the data. We’ve developed the Nearshore Calculator, a strategic tool designed to show you exactly how much your organization can save by migrating development to elite LATAM clusters.
The "Total Cost of Talent" (TCT)
A standard salary comparison only tells 50% of the story. To understand the true ROI, a CFO must look at the Total Cost of Talent, which includes:
- Recruitment Velocity: The Talentus Marketplace fills roles in 48 hours, eliminating the 30-day "vacancy burn" common in the USA.
- Operational Drag: Our Managed IT services handle the hardware and security overhead, moving those costs from your internal plate to our specialized pods.
- The Synchronicity Dividend: Because our Top 5% LATAM talent works in your Same Time-Zone, you avoid the productivity loss of 12-hour communication delays found in Asia or Eastern Europe.
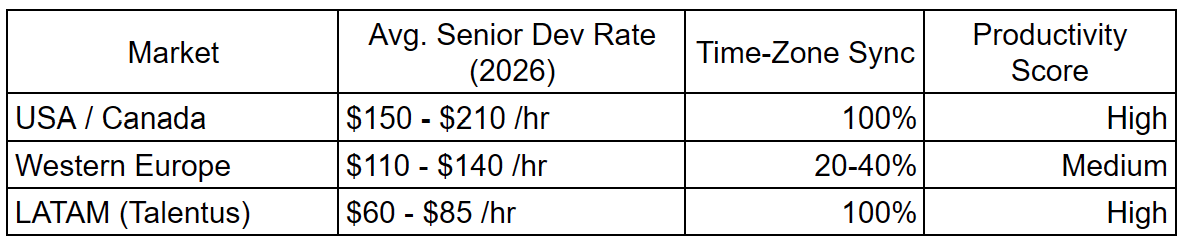
The Math: USA, Canada, & Europe vs. LATAM
When we run the numbers through our calculator, the trend for 2026 is clear. While specialized engineering roles in North America and Europe have skyrocketed due to the Agentic AI boom, LATAM remains the most competitive region for "Price-to-Performance" ratio.
The Talentus Twist: Retention is Your Best ROI Feature
Hidden in every CFO’s spreadsheet is the "Churn Tax." Replacing a senior developer in the US can cost up to 2x their annual salary in lost momentum and recruitment fees.
With Talentus Global’s 95% retention rate, your investment stays within your company. You aren't just paying for hours; you are investing in a stable, synchronized team that retains institutional knowledge for the long haul.
How to Use the Calculator for Your Q3 Planning
Our calculator doesn't just give you a generic number. It allows you to input:
- Region of Origin: (USA, Canada, or Europe)
- Specific Roles: (From Agentic AI Architects to SIS/LMS Integration Leads)
- Team Size: (Individual Smart Sourcing vs. Dedicated Clusters)
The result is a detailed ROI report that you can take directly to the board to justify your 2026 scaling strategy.
Conclusion: Efficiency is the Ultimate Innovation
In 2026, the most successful tech companies are those that optimize their human capital without sacrificing their technical velocity. The Nearshore Calculator is your first step toward a leaner, faster, and more profitable roadmap.
Stop guessing. Start calculating.
Run Your ROI Report Now FOR FREE By Clicking Here